Description
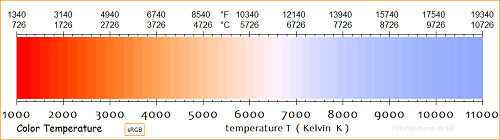
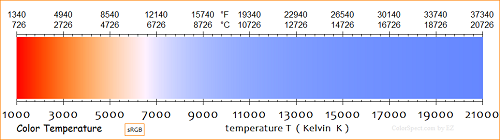
Color Temperature Charts
Charts show hue and saturation versus color temperature. Color temperature (CT) charts calculated using Planck's radiation law for a black body and CIE 1931 2° colour-matching functions. Correlated color temperature (CCT) lines determined by using the McCamy epicenter.
keywords: chromaticity x, y, sRGB